
Documentation
Reports
Insights into your restaurant's performance.
Reports
Understand how your location is performing over time, with key metrics and visual breakdowns of your orders and revenue.
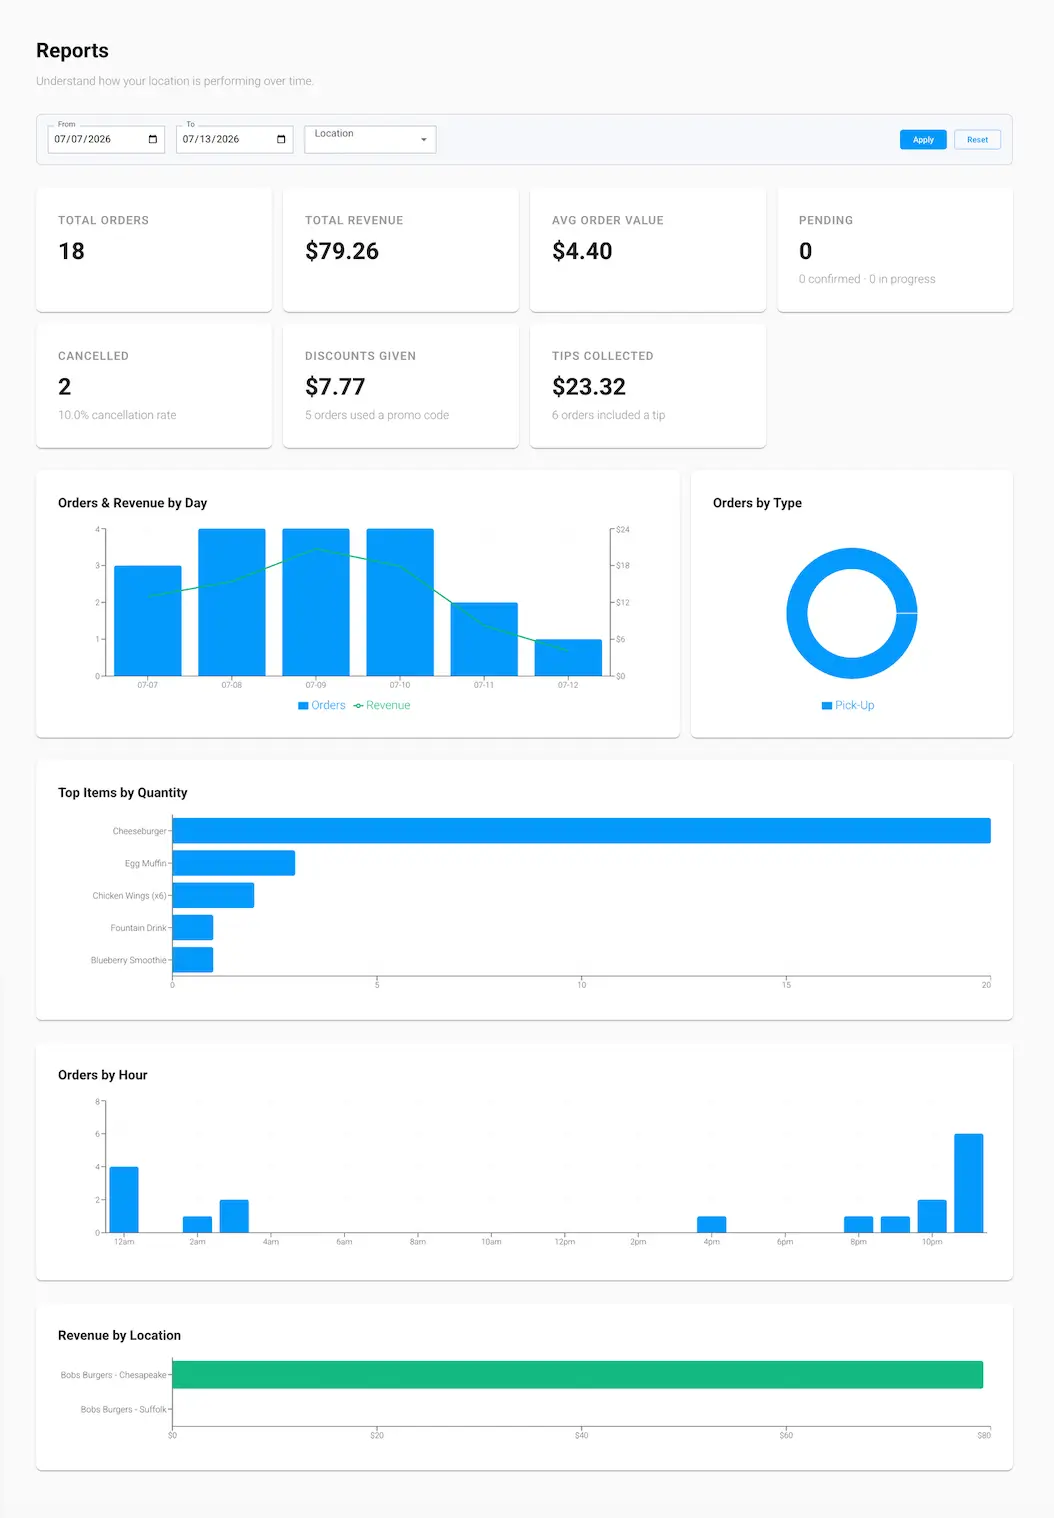
Filtering by date and location
Use the From and To fields to set the date range, and the Location dropdown (if you manage more than one location) to scope the report to a single location. Click Apply to run the report, or Reset to return to the default range — the last 7 days, across all locations.
What's in this section
- Stat Cards → key performance metrics at a glance
- Charts and Graphs → visual breakdowns of revenue, order types, top items, and more